



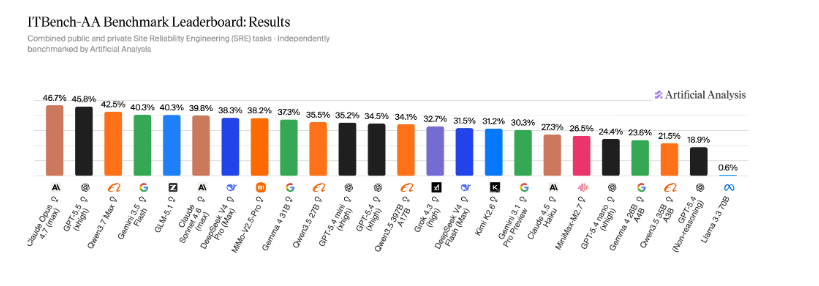
Artificial Analysis and the IBM Software Innovation Lab launch ITBench-AA, the first in a new series of benchmarks that evaluate models on enterprise IT tasks for agents. It starts with site reliability engineering tasks where the Frontier model scores less than 50%. The SRE task in ITBench-AA benchmarks model performance in Kubernetes incident response. Models and agents must diagnose live systems by reading logs, tracking dependencies, and identifying root cause entities across complex infrastructures. The underlying ITBench dataset was developed by IBM, leveraging deep expertise in enterprise IT operations. Artificial Analysis has been working closely with IBM over the past six months to develop a dataset implementation for Frontier AI evaluations, starting with site reliability engineering (SRE) and extending over time to financial operations (FinOps) and chief information security officer (CISO) tasks.
Key findings:
Claude Opus 4.7 (Adaptive Reasoning, Max Effort) takes the top spot with 47%, followed by GPT-5.5 (xhigh) with 46% and Qwen3.7 Max with 42%. All Frontier models score below 50%, making ITBench-AA SRE one of the least saturated agent benchmarks in the suite. For context, the Frontier model scores fairly high on the terminal bench. The number of turns varies by a factor of nearly 3, and longer trajectories do not lead to higher accuracy. GPT-5.5 (xhigh) averages 31 turns (46%) per task, while Gemini 3.1 Pro Preview averages 83 turns (30%). Models that overprobe tend to surface upstream fault injection mechanisms and co-occurring symptoms as false positives. GLM-5.1 (Reasoning) leads the open weight model with 40% and is virtually tied with Gemini 3.5 Flash (High). DeepSeek V4 Pro (Reasoning, Max Effort) follows with 38%, followed by Gemma 4 31B (Reasoning) with 37%, ahead of Gemini 3.1 Pro Preview’s 30%.
ITBench-AA SRE overview:
59 total SRE tasks: 40 public tasks and 19 new pending tasks Each task provides a Kubernetes incident snapshot that includes alerts, events, traces, metrics, logs, and application topology. The model should identify a minimal set of independent root cause Kubernetes entities that are causing the incident. Failures span common SRE failure modes, including infrastructure, service, application, and chaos-injected incidents such as resource quota exhaustion, rollout failures, connection pool exhaustion, and network partitions. Methodology details: Agent harness: Each task is solved by a model running in the open-source Stirrup reference harness with shell access to a sandboxed file system containing associated logs and snapshots. Limit of 100 turns per task, 3 repeats per task. The model and agent submit a list of root cause entities (Kubernetes deployments, services, pods, etc.) that may have caused the incident. Each submission is compared to a ground truth set of root causes provided by IBM. Scoring uses the average precision at perfect recall. If the model misses any of the root causes, it receives a score of 0.0 for that iteration. If you identify them all, you are given a score equal to its accuracy, i.e. the proportion of submitted entities that are the actual root cause, i.e. true positives / (true positives + false positives). The heading score is the average of 59 tasks × 3 repetitions. The harness (stirrup) is kept constant across all models evaluated, allowing apples-to-apples comparisons between models.
highlights
The task requires the agent to examine a snapshot of a Kubernetes incident through shell commands and send structured JSON diagnostics that identify the responsible root cause entity. In one public SRE task, the agent recognizes the failures faced by users in the front-end path. Inspect offline snapshots using shell commands. Upon reviewing the alert, an incident window will appear and traces/logs will narrow down the front-end traffic failure. The topology identifies the affected services, and the Kubernetes manifest reveals the network policy blocking the front end. A successful diagnosis identifies the responsible root cause entity (otel-demo/NetworkPolicy/frontend-block-all-ports).

More turns does not necessarily mean a better answer. Models that submit additional contributing entities beyond the true root cause are penalized. Even if you identify the correct root cause, adding upstream mechanisms (such as chaotic mesh controllers) or co-occurring symptoms will still count as false positives for recall gate accuracy. This is why some models with longer trajectories perform worse than more concise models. Gemini 3.1 Pro Preview averages 83 turns and scores 30%, while Gemma 4 31B (Reasoning) averages 58 turns and scores 37%.


The open weight model is at the forefront of ITBench-AA SRE cost. Gemma 4 31B (Reasoning) scores 37% at $0.14 per task, outperforming Gemini 3.1 Pro Preview ($2.23 per task, 30%) in both score and cost. GLM-5.1 (Reasoning) scores 40% at $1.23 per task, comparable to Gemini 3.5 Flash (High) ($1.70) in low-cost scores. Claude Opus 4.7 (Adaptive Reasoning, Max Effort) leads the leaderboard with 47%, but is the most expensive at $5.38 per task.

ITBench-AA is built on the ITBench benchmark in partnership with @IBM.

